
TL;DR
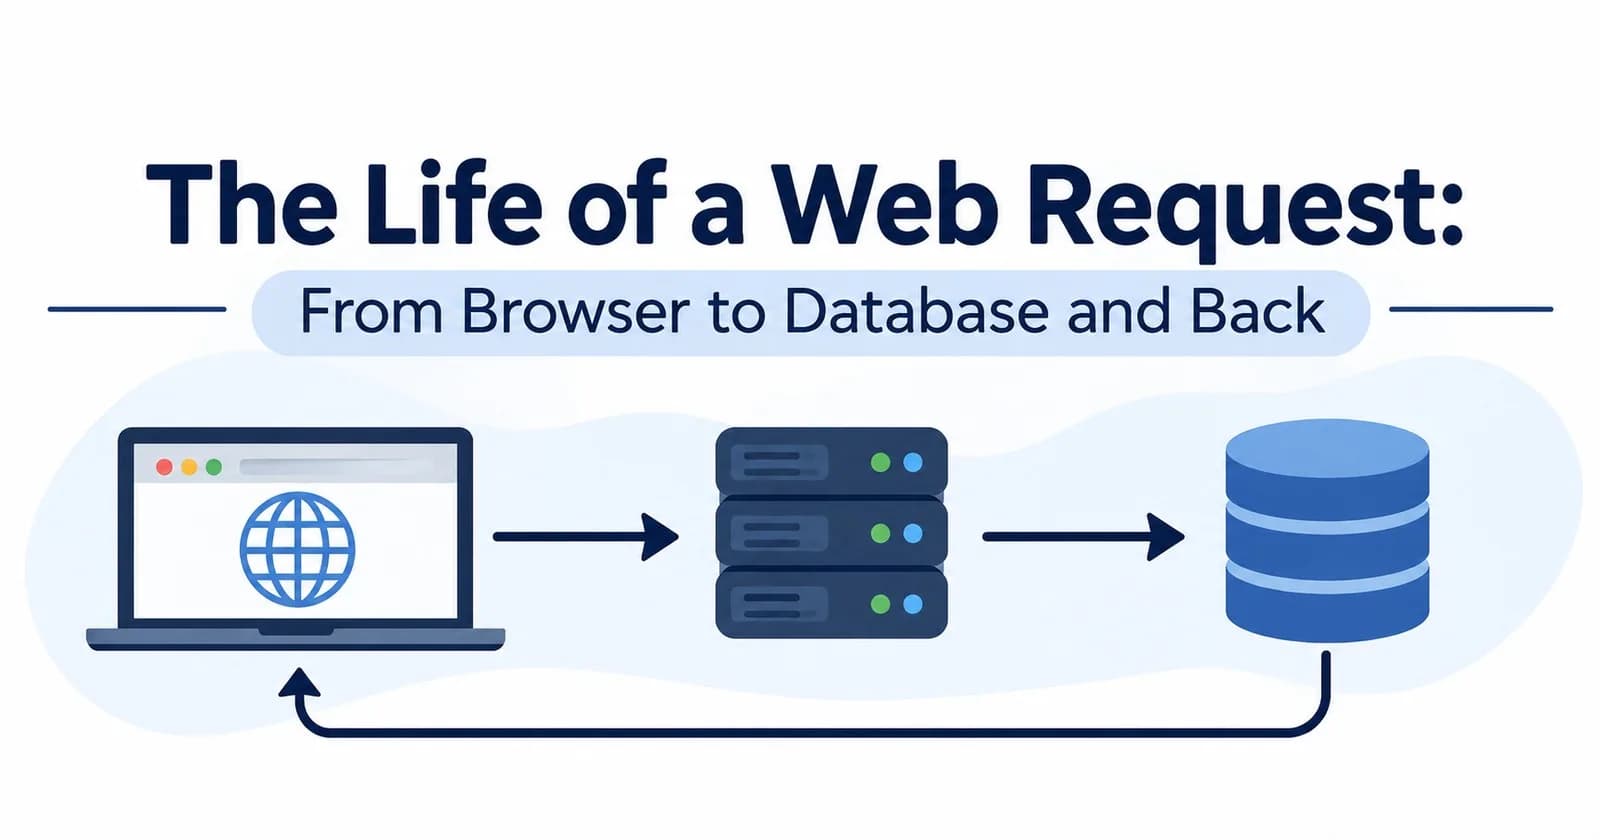
One page view is a relay race across at least seven systems: browser, DNS, load balancer, app server, cache, database, and the network between all of them.
Before your server sees a single byte, the browser usually spends three round trips on DNS, TCP and TLS.
On a first visit from a distant user, your code and database can account for only a few percent of the total latency. The rest is distance and handshakes.
Every hop has its own cache, its own timeout and its own failure signature. Learn to read the symptoms and you can name the broken hop in seconds.
You type https://shop.example.com/products/42 and press Enter. About 300 ms later, a product page appears. Nothing about that feels complicated, but in those 300 ms your request crossed half a dozen machines owned by different people, negotiated encryption with a server it had never met, and probably touched a cache and a database.
This post follows that single request from keypress to pixels. We will start with the whole journey on one diagram, then zoom in on each stop and look at what it does, what it costs, and how it fails.
1. The whole journey on one diagram
Here is our setup: a typical web app with a load balancer in front of a few identical app servers, a Redis cache, and a Postgres database. Read this diagram top to bottom. Each shaded band is a phase, and the rest of the post takes them one at a time.
sequenceDiagram
    autonumber
    participant B as Browser
    participant R as DNS resolver
    participant A as Authoritative DNS
    participant LB as Load balancer
    participant App as App server
    participant C as Cache (Redis)
    participant DB as Database (Postgres)

    rect rgba(80, 140, 255, 0.14)
    Note over B,A: Phase 1 - DNS: turn a name into an IP address
    B->>R: A / AAAA record for shop.example.com?
    R->>A: cache miss, walk root, TLD, then authoritative
    A-->>R: 203.0.113.10, TTL 300 s
    R-->>B: 203.0.113.10
    end

    rect rgba(60, 190, 120, 0.14)
    Note over B,LB: Phase 2 - TCP and TLS: connect, then establish trust
    B->>LB: TCP SYN
    LB-->>B: SYN-ACK
    B->>LB: ACK
    B->>LB: TLS ClientHello (SNI, ALPN, key share)
    LB-->>B: ServerHello, certificate, Finished
    B->>LB: Finished, encrypted channel ready
    end

    rect rgba(255, 170, 60, 0.14)
    Note over B,App: Phase 3 - HTTP request through the load balancer
    B->>LB: GET /products/42 (encrypted)
    Note over LB: Terminate TLS, pick a healthy backend
    LB->>App: GET /products/42 plus X-Forwarded-For
    end

    rect rgba(190, 100, 220, 0.14)
    Note over App,DB: Phase 4 - Application work
    App->>C: GET product:42
    alt cache hit
        C-->>App: cached JSON
    else cache miss
        C-->>App: nil
        App->>DB: SELECT ... FROM products WHERE id = 42
        DB-->>App: 1 row
        App->>C: SET product:42 EX 60
    end
    end

    rect rgba(130, 130, 130, 0.14)
    Note over B,App: Phase 5 - The trip back
    App-->>LB: 200 OK plus body
    LB-->>B: 200 OK (encrypted)
    end
A few things to notice before we zoom in:
Phases 1 and 2 happen before the browser has sent a single byte of your application's request. They are pure overhead, and they are paid per new connection, not per request.
The load balancer appears in two roles: it is the TLS endpoint for the browser and an HTTP client to your app.
The
altblock in phase 4 is where most of your performance tuning lives. A cache hit skips the database entirely.
Where does a CDN fit? In many real deployments the IP address that DNS returns is not your load balancer but a CDN edge server (Cloudflare, CloudFront, Fastly and similar). The edge terminates TLS close to the user, serves cached responses itself, and forwards only misses to your origin. The diagram above describes the origin path, which is what runs whenever the edge cannot answer.
2. Phase 1: DNS turns a name into an address
Computers route to IP addresses, not names. Before connecting, the browser must find out which IP shop.example.com lives at. That lookup passes through a stack of caches, and only a miss goes all the way out:
sequenceDiagram
    participant B as Browser
    participant OS as OS stub resolver
    participant R as Recursive resolver
    participant Root as Root server
    participant TLD as com TLD server
    participant Auth as example.com nameserver

    B->>B: browser DNS cache (miss)
    B->>OS: resolve shop.example.com
    OS->>OS: hosts file and OS cache (miss)
    OS->>R: A and AAAA query over UDP port 53
    R->>R: resolver cache (miss)
    R->>Root: shop.example.com?
    Root-->>R: ask the com servers
    R->>TLD: shop.example.com?
    TLD-->>R: ask the example.com nameservers
    R->>Auth: shop.example.com?
    Auth-->>R: A 203.0.113.10, TTL 300
    R-->>OS: 203.0.113.10 (cached for 300 s)
    OS-->>B: 203.0.113.10
Who is who:
The recursive resolver (your ISP's, or a public one such as
1.1.1.1or8.8.8.8) does the legwork on your behalf and caches what it learns.Root and TLD servers do not know your IP. They only point to the next server down the hierarchy.
The authoritative nameserver holds the real records for
example.com.
Caching is everything. Every answer carries a TTL (time to live). The browser, the OS and the resolver each keep the answer for roughly that long (browsers and some resolvers apply their own minimum or maximum limits). In practice root and TLD referrals are almost always cached, so a typical "miss" only talks to the authoritative server. A fully warm lookup costs about 0 ms. An uncached one costs tens of milliseconds, and it is slower still if the resolver is far away.
You can watch it happen yourself:
dig shop.example.com A +noall +answer   # what a resolver returns, including the TTL
dig +trace shop.example.com             # walk root -> TLD -> authoritative yourself
The answer line looks like shop.example.com. 300 IN A 203.0.113.10, where 300 is the remaining TTL in seconds.
How DNS bites you in production:
Migrations that "don't take effect." If the record's TTL is 24 hours, some users keep hitting the old IP for up to a day. Lower the TTL one full old-TTL before you change the record.
Negative caching. A failed lookup (
NXDOMAIN) is cached too. Create a record minutes after someone looked it up and they may keep seeing "not found" for a while.IPv4 vs IPv6. Browsers ask for both
AandAAAArecords and race the connections ("Happy Eyeballs"). A broken IPv6 path used to mean seconds of delay. The race exists to hide that.
3. Phase 2: TCP and TLS, the connection tax
With an IP address in hand, the browser opens a TCP connection (a reliable byte stream), then layers TLS on top to get encryption and proof of identity. Each takes a network round trip.
sequenceDiagram
    participant B as Browser
    participant S as Load balancer

    Note over B,S: TCP handshake: 1 round trip
    B->>S: SYN
    S-->>B: SYN-ACK
    B->>S: ACK

    Note over B,S: TLS 1.3 handshake: 1 round trip
    B->>S: ClientHello (SNI, ALPN h2, key share)
    S-->>B: ServerHello (key share)
    S-->>B: Certificate, CertificateVerify, Finished (encrypted)
    B->>S: Finished

    Note over B,S: Encrypted channel ready
    B->>S: HTTP request as application data
What the TLS handshake accomplishes:
Key agreement. Both sides contribute key shares and derive the same session keys, without ever sending the keys themselves.
Authentication. The server proves it owns
shop.example.comby presenting a certificate signed by a certificate authority the browser trusts. The browser checks the signature chain, the hostname, and the validity dates.Negotiation. Two small extensions in the
ClientHellomatter a lot in practice: SNI tells the server which hostname you want (so one IP can serve many certificates), and ALPN agrees on the application protocol (h2for HTTP/2, orhttp/1.1).
Round trips before the request can even be sent (the number to remember):
Setup | Round trips before the first request byte |
|---|---|
TCP + TLS 1.2 | 3 (1 TCP + 2 TLS) |
TCP + TLS 1.3 | 2 (1 TCP + 1 TLS) |
TCP + TLS 1.3 resumption (0-RTT) | 1 (the TLS part rides along with the request, with replay caveats) |
HTTP/3 over QUIC | 1 (transport and crypto handshake combined) |
Two practical consequences. First, connection reuse is a performance feature: keep-alive connections and HTTP/2 multiplexing mean the handshake is paid once, then amortized over many requests. Second, distance multiplies everything: at an 80 ms round trip, TCP plus TLS 1.3 alone costs 160 ms before your server does anything.
Inspect a real certificate from the command line:
openssl s_client -connect shop.example.com:443 -servername shop.example.com </dev/null 2>/dev/null \
  | openssl x509 -noout -subject -issuer -dates
An expired certificate or a hostname mismatch fails right here, and the browser shows a full-page warning, which is a very different symptom from a slow or broken application.
4. Phase 3: the load balancer
The IP address belongs to a load balancer (LB). It accepts the connection, decrypts the traffic, and decides which app server gets the request.
flowchart LR
    U["Browser"] -->|HTTPS| LB["Load balancer<br/>TLS termination<br/>health checks"]
    LB -->|HTTP, keep-alive| A1["App 1: healthy"]
    LB -->|HTTP, keep-alive| A2["App 2: healthy"]
    LB -.->|skipped: failed health check| A3["App 3: unhealthy"]
    A1 --> C[("Redis")]
    A2 --> C
    A1 --> D[("Postgres")]
    A2 --> D
What it does for you:
TLS termination. Certificates live in one place. Traffic to the apps is plain HTTP inside your private network (or re-encrypted if your threat model demands it).
Distribution. Round robin, least connections, or hashing on a key (useful when you want the same user or URL to land on the same backend for cache locality).
Health checks. The LB probes each backend (for example
GET /healthzevery few seconds) and stops routing to ones that fail.Header rewriting. Because the LB is now the one talking to your app, your app sees the LB's IP as the client. So the LB adds the original details:
GET /products/42 HTTP/1.1
Host: shop.example.com
X-Forwarded-For: 198.51.100.7
X-Forwarded-Proto: https
X-Request-ID: 7f3a9c1e
Layer 4 vs. layer 7:
L4 (transport) | L7 (application) | |
|---|---|---|
Sees | IPs, ports, TCP/UDP | HTTP method, path, headers, cookies |
Typical features | Fast forwarding, TLS passthrough | TLS termination, path routing, retries, header rewriting |
Cost | Lower latency and CPU | More CPU, far more flexibility |
Two failure modes worth memorizing:
The health check that is too clever. If
/healthzchecks the database and the database blips, every instance fails its check at once and the LB has nowhere to send traffic. Turning a partial outage into a total one is a classic. Keep health checks about "can this process serve requests."The keep-alive timeout mismatch. The LB reuses idle connections to your app. If your app closes idle connections sooner than the LB expects, the LB occasionally sends a request down a connection that was just closed and returns a 502 to the user, intermittently, with nothing in your app logs. The fix is to make the app's timeout longer than the LB's idle timeout. Node.js is a well-known trap here, because its default
keepAliveTimeoutis only 5 seconds, far below the 60 s idle timeout many load balancers use:
const server = http.createServer(app);
server.keepAliveTimeout = 65_000; // longer than the LB's 60 s idle timeout
server.headersTimeout = 66_000;   // keep this above keepAliveTimeout
5. Phase 4a: the app server, the orchestrator
The app receives a plain HTTP request. A typical framework runs it through a pipeline: parse headers and body, authenticate (often a session lookup, which is itself frequently a cache call), apply rate limits, route to a handler, and then the handler does the real work: it asks the cache, falls back to the database, and builds a response.
The most common handler shape in the world is cache-aside (also called lazy loading):
async function getProduct(id) {
  const key = `product:${id}`;

  const cached = await cache.get(key);        // ~0.5 ms in the same datacenter
  if (cached) return JSON.parse(cached);      // cache hit: done

  const { rows } = await db.query(            // ~2-5 ms for an indexed lookup
    'SELECT id, name, price_cents FROM products WHERE id = $1',
    [id]
  );
  const product = rows[0] ?? null;

  // Cache "not found" too (negative caching), with a shorter TTL,
  // so requests for nonexistent ids do not hammer the database.
  await cache.set(key, JSON.stringify(product), 'EX', product ? 60 : 10);
  return product;
}
Every await in a handler is a network round trip to another machine. That makes the N+1 query pattern especially expensive: one round trip for a list, then one more per item.
// N+1: 51 round trips for 50 products
const { rows: products } = await db.query('SELECT id, name FROM products LIMIT 50');
for (const p of products) {
  p.reviews = (await db.query('SELECT * FROM reviews WHERE product_id = $1', [p.id])).rows;
}

// 2 round trips total
const { rows: reviews } = await db.query(
  'SELECT * FROM reviews WHERE product_id = ANY($1)',
  [products.map((p) => p.id)]
);
6. Phase 4b: the cache, and the two ways it betrays you
A cache hit turns a multi-millisecond database query into a sub-millisecond lookup, and it shields the database from load. But caches introduce two classic bugs.
Failure 1: the stampede
A popular key expires. In the next few milliseconds, hundreds of requests all miss at once, and all of them query the database for the same row. The database that the cache was protecting gets flattened.
Three standard defenses, usually combined:
Request coalescing (single-flight): let the first miss do the work, and make concurrent requests for the same key wait for it.
TTL jitter: add randomness to expiry (
60 + random(0..10)seconds) so hot keys do not all expire together.Stale-while-revalidate: serve the slightly old value while one request refreshes it in the background.
A minimal in-process single-flight wrapper around the function above:
const inflight = new Map();

function getProductCoalesced(id) {
  const key = `product:${id}`;
  if (inflight.has(key)) return inflight.get(key);   // join the request already running

  const promise = getProduct(id).finally(() => inflight.delete(key));
  inflight.set(key, promise);
  return promise;
}
With this in place, 100 concurrent requests for a cold key produce one database query per app process instead of 100.
Failure 2: the stale write
Invalidating on write sounds simple: update the row, delete the cache key.
async function updatePrice(id, priceCents) {
  await db.query('UPDATE products SET price_cents = $1 WHERE id = $2', [priceCents, id]);
  await cache.del(`product:${id}`);   // delete AFTER the DB commit
}
But two concurrent requests can interleave so the old value gets written back into the cache after you deleted it:
sequenceDiagram
    participant R as Reader request
    participant W as Writer request
    participant C as Cache
    participant DB as Database

    R->>C: GET product:42
    C-->>R: miss
    R->>DB: SELECT price (reads 10.00)
    W->>DB: UPDATE price = 12.00 and COMMIT
    W->>C: DEL product:42
    R->>C: SET product:42 = 10.00
    Note over C: Stale value cached until the TTL expires
The window is small, so it is rare, which is exactly why it is nasty to debug. The practical answer is to always set a TTL so any staleness is bounded, and to reach for versioned keys or write-through designs when staleness is unacceptable.
7. Phase 4c: the database
On a cache miss, the query goes to Postgres through a connection pool. That matters because Postgres uses a separate OS process per connection, so opening one per request is expensive. A pool (in your app, or a proxy like PgBouncer) keeps a few dozen long-lived connections and lends them out.
Once a connection is free, the query goes through a pipeline:
flowchart LR
    Q["SQL text"] --> P["Parse<br/>syntax check"]
    P --> AN["Analyze and rewrite<br/>resolve names, views, rules"]
    AN --> PL["Plan<br/>pick index scan or full scan"]
    PL --> EX["Execute<br/>read pages from shared buffers or disk"]
    EX --> RES["Rows back to the client"]
The planner is where performance is won or lost. For WHERE id = 42 on a primary key, it chooses a B-tree index lookup that touches a handful of pages, usually already in memory. Without an index it would scan the whole table. To see what it decided:
EXPLAIN (ANALYZE, BUFFERS)
SELECT id, name, price_cents FROM products WHERE id = 42;
Look for Index Scan vs Seq Scan, the actual time, and how many buffers were served from memory (shared hit) vs read from disk (read). Prepared statements let Postgres skip some parse and plan work on repeated queries.
8. Phase 5: the trip back
The response retraces the path in reverse. Along the way:
HTTP/1.1 200 OK
Content-Type: application/json
Content-Encoding: br
Cache-Control: public, max-age=60
ETag: "v17"
Compression (
Content-Encoding: brorgzip) shrinks the body, which matters most on slow links. It is usually applied by the app, a reverse proxy such as nginx, or a CDN, and many load balancers simply pass the compressed bytes through.Cache headers tell the browser (and any CDN) how long it may reuse the response without asking again. After
max-agepasses, the browser can send a conditional request withIf-None-Match: "v17", and the server can answer 304 Not Modified with no body.Connection reuse. The browser keeps the TLS connection open. The next request to the same origin (CSS, JavaScript, images, the next page) skips phases 1 and 2 entirely. With HTTP/2, many of those requests share one connection in parallel.
Only now does the browser parse the HTML, discover more resources, and render. Everything above was just the first byte.
9. Where does the time actually go?
Here is an illustrative first visit for a user whose round trip to the server is 80 ms, with typical in-datacenter numbers behind the load balancer (these are example figures, not benchmarks):
gantt
    title Time to first byte for a first visit (80 ms round trip to the server)
    dateFormat x
    axisFormat %L ms
    section Connection setup
    DNS lookup (cache miss)      :dns, 0, 60ms
    TCP handshake                :tcp, after dns, 80ms
    TLS 1.3 handshake            :tls, after tcp, 80ms
    section Request
    Request travels to the LB    :req, after tls, 40ms
    Server work (LB, app, cache, DB) :srv, after req, 10ms
    Response travels back        :resp, after srv, 40ms
Add it up: 60 + 80 + 80 + 40 + 10 + 40 = 310 ms, of which your servers account for 10 ms, about 3%. Optimizing a query from 5 ms to 4 ms here is invisible to the user. If a CDN edge cut the round trip from 80 ms to 20 ms, a page the edge can answer itself would save about 180 ms (three round trips of 60 ms each), far more than any query tuning could.
Rough order-of-magnitude costs to keep in your head:
Step | Typical cost |
|---|---|
DNS lookup | ~0 ms cached, tens of ms uncached |
TCP handshake | 1 round trip (a few ms to 200+ ms depending on distance) |
TLS 1.3 handshake | 1 more round trip |
LB to app, same datacenter | well under 1 ms to a few ms |
Redis | around 0.2 to 1 ms |
Indexed Postgres lookup, data in memory | often 1 to 5 ms |
Postgres query that must read from disk | tens of ms or worse |
10. Debugging by symptom
When something is wrong, the symptom usually points at the hop:
Symptom | Most likely hop | First thing to check |
|---|---|---|
| DNS |
|
Browser certificate warning | TLS |
|
Connection hangs, then times out | TCP / network | Firewall, security group, LB listener, wrong IP |
502 Bad Gateway | LB to app | App crashed or restarting, or the keep-alive timeout mismatch |
503 Service Unavailable | LB | No healthy backends (check health checks) |
504 Gateway Timeout | LB waiting on app | Slow handler, slow DB query, exhausted connection pool |
Slow on first visit only | DNS, TCP, TLS, cold cache | Distance; add a CDN, enable TLS 1.3 and HTTP/2 or HTTP/3 |
Slow always, DB CPU high | DB |
|
Latency spike at the same interval | Cache | TTLs expiring in sync (stampede) |
Two tools give you the per-phase breakdown directly. curl reports cumulative timestamps for each stage:
curl -s -o /dev/null https://shop.example.com/products/42 -w \
"dns:     %{time_namelookup}s\ntcp:     %{time_connect}s\ntls:     %{time_appconnect}s\nttfb:    %{time_starttransfer}s\ntotal:   %{time_total}s\n"
These values are cumulative from the start, so the TLS handshake took tls - tcp, and the wait for the response (one network round trip plus the server's think time) is roughly ttfb - tls. In Chrome DevTools, the Network tab's Timing view breaks a request into Queueing, Stalled, DNS Lookup, Initial connection, SSL, Request sent, Waiting for server response (TTFB), and Content Download.
11. Shaving each hop
Hop | Levers |
|---|---|
DNS | Sensible TTLs, fewer distinct hostnames, |
TCP + TLS | Keep-alive, TLS 1.3, HTTP/2 or HTTP/3, |
Load balancer | Right-size idle timeouts, simple health checks, connection reuse to backends |
App | Avoid N+1 queries, do independent calls in parallel, stream large responses |
Cache | TTL jitter, request coalescing, negative caching, sensible invalidation |
Database | Indexes that match your queries, a connection pool, |
Response | Compression, |
12. The mental model on one screen
A request is a relay: each hop receives, transforms, and forwards. Every hop adds latency and can fail on its own.
Connection setup (DNS + TCP + TLS) is a per-connection cost, usually 2 to 3 round trips. Reuse connections.
The load balancer terminates TLS, picks a healthy backend, and speaks HTTP to your app. Mismatched timeouts show up as mysterious 502s.
The cache shields the database but needs a TTL, jitter and coalescing to avoid stampedes and bounded staleness.
The database wins or loses on its query plan. Indexes and connection pools do most of the work.
Distance dominates. On a first visit from a distant user, server time can be only a single-digit percent of what they feel.
Further reading
The primary sources for each layer:
DNS: RFC 1035, Domain Names: Implementation and Specification
Happy Eyeballs (IPv4/IPv6 racing): RFC 8305, Happy Eyeballs Version 2
TLS 1.3: RFC 9846, The Transport Layer Security (TLS) Protocol Version 1.3. Published in July 2026, it obsoletes RFC 8446, which older articles still cite.
HTTP semantics: RFC 9110, HTTP Semantics
QUIC: RFC 9000, QUIC: A UDP-Based Multiplexed and Secure Transport
HTTP/3: RFC 9114, HTTP/3
Tools and documentation:
PostgreSQL documentation: Overview of PostgreSQL Internals walks through the parse, rewrite, plan and execute pipeline.
Chrome DevTools: Network features reference covers the Network panel, including the per-request Timing breakdown.
If this post helped, send it to the teammate who says "it's probably the database" before looking at the timing breakdown.
Comments(0)
Join the discussion by logging into your account.
No comments yet. Be the first to comment!