
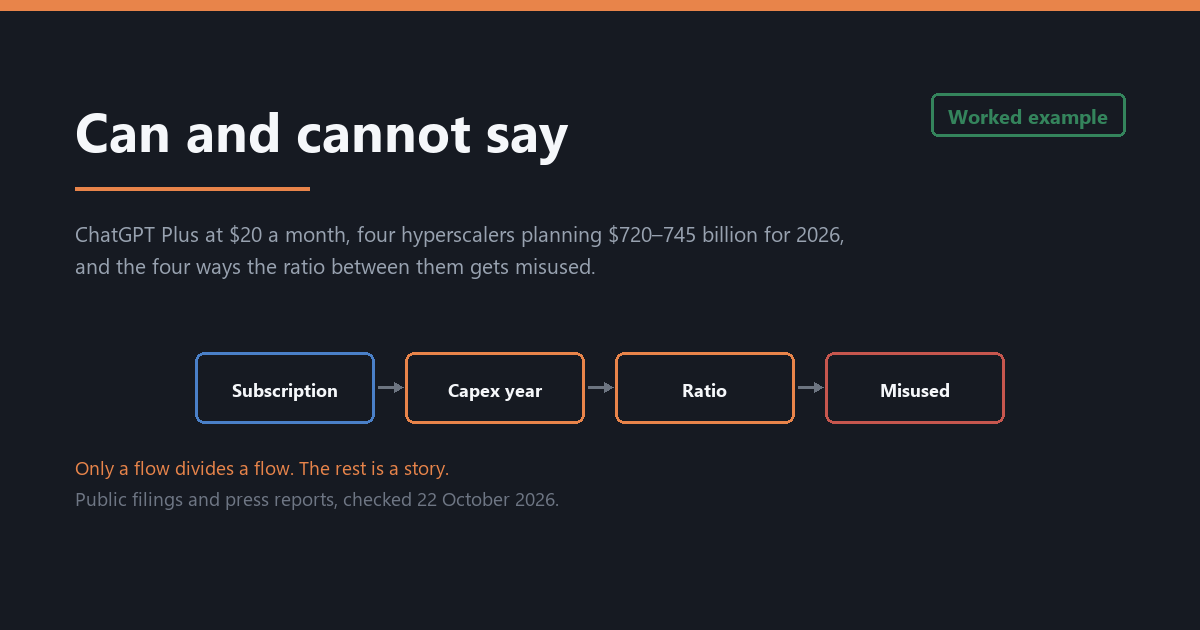
What ChatGPT Plus at $20 a Month Can and Cannot Say About a $732 Billion Capex Year
One worked example, one script, and the parts of the chain that no public document closes.
The subject here is one line item: ChatGPT Plus, OpenAI's consumer plan at $20 per month. OpenAI's official pricing pages returned HTTP 403 during this check on 22 October 2026, so the $20 is a third-party figure here. A reported rise to $24 on 15 June 2026 is not adopted, because the sources disagree about the effective date.
OpenAI is not alone at that price. Claude Pro is also $20 per month on Anthropic's official pricing page, which states that the figure excludes Console API usage; Claude Max is $100 and $200. I use OpenAI for the company and ChatGPT Plus for its consumer plan, not the metered API.
[!NOTE] The short version
- The two numbers are $240 of subscription per subscriber per year, and $720–745 billion of 2026 capital expenditure guidance from four hyperscalers, a median of $732.5 billion.
- Flows can be divided by flows over the same period, and stocks compared with stocks at the same date; a stock divided by a flow is only a duration. A price is not a flow, and revenue is not capex.
- Four misuses follow this ratio around: stock divided by flow; fiscal year mixed with calendar year; commitment counted as cash; revenue, cost and one-offs in one column.
- No public document allocates a subscription's cost across memory, packaging, compute and software.
What These Two Numbers Are
One ChatGPT Plus subscription is $20 per month, or $240 per year for one subscriber. That is arithmetic on a price, not a disclosure, and the price is third-party while OpenAI's pricing pages are unavailable.
The second number is the four hyperscalers' 2026 capital expenditure guidance: $720–745 billion, a median of $732.5 billion, against about $410 billion for 2025. Both figures come from company guidance aggregated by the press and brokers, checked on 22 October 2026. The aggregate mixes definitions, and one of the four reports on a fiscal year ending 30 June rather than a calendar year.
The third pair belongs to OpenAI: $13.07 billion of 2025 revenue against $34 billion of cost and expenses, from an audited document obtained by the press and independently verified by the Financial Times, checked on 22 October 2026. OpenAI has not published this statement itself.
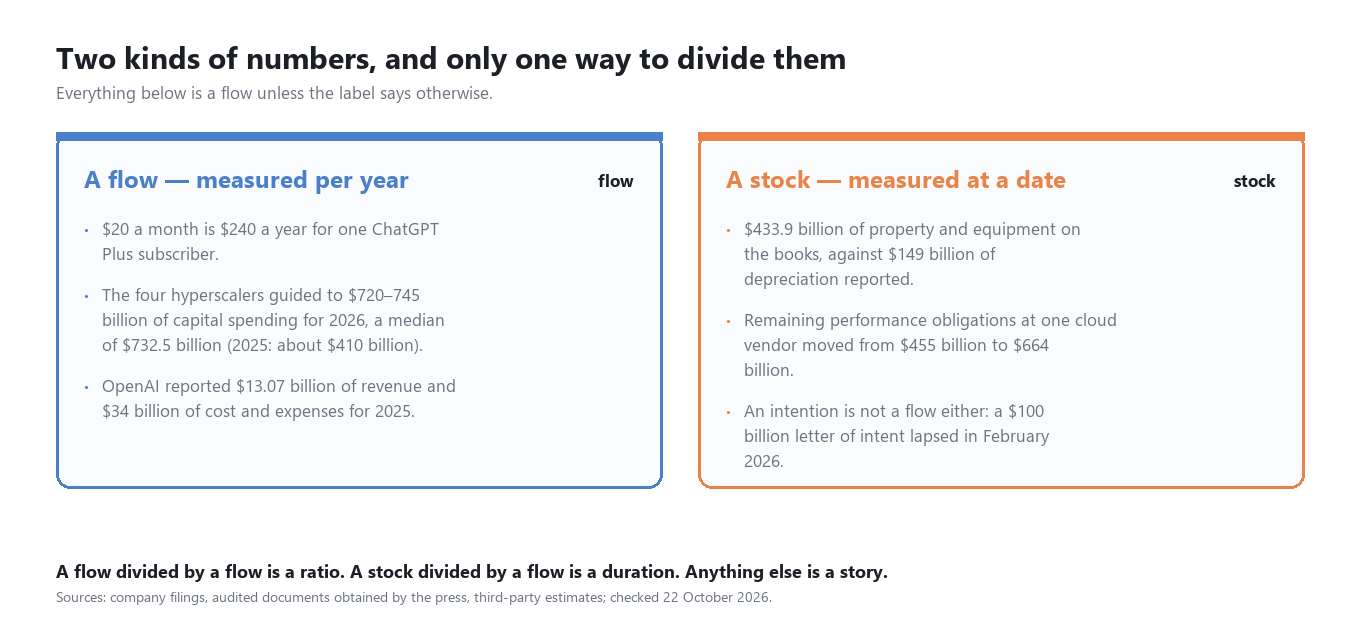
These items differ in kind, which is why the ratio is dangerous. The $240 is a price multiplied by twelve. The capex figure is a plan for a year. Revenue and cost are results for a year. Only the last three are flows of money, and only two of them cover the same twelve months.
| Number | What It Counts | Period | Basis |
|---|---|---|---|
| $240 | One ChatGPT Plus subscriber, twelve months | One year | Arithmetic on a third-party price |
| $720–745 billion | 2026 capital expenditure guidance, four hyperscalers | 2026 | Company guidance aggregated by the press |
| $13.07 billion | OpenAI revenue | 2025 calendar year | Audited document obtained by the press |
| $34 billion | OpenAI cost and expenses | 2025 calendar year | Audited document obtained by the press |
The Arithmetic That Can Be Done
REVENUE_2025 = 13.07e9        # OpenAI, 2025
COST_2025 = 34.0e9            # cost and expenses, same year
CAPEX_2026 = 732.5e9          # median of four hyperscalers' 2026 guidance
CAPEX_2025 = 410e9
SUBSCRIPTION_YEAR = 20 * 12   # ChatGPT Plus, per subscriber per year
PPE = 433.9e9                 # property and equipment on the books
DEPRECIATION = 149e9          # depreciation reported against it

print(f"revenue as a share of the 2026 capex: {REVENUE_2025 / CAPEX_2026:.2%}")
print(f"the 2026 capex against 2025: {CAPEX_2026 / CAPEX_2025 - 1:.1%} higher")
print(f"equipment on the books divided by one year of depreciation: {PPE / DEPRECIATION:.1f} years")
print(f"cost and expenses against revenue: {COST_2025 / REVENUE_2025:.2f}x")
print(f"subscriber-years needed to match one year of capex: {CAPEX_2026 / SUBSCRIPTION_YEAR:,.0f}")
revenue as a share of the 2026 capex: 1.78%
the 2026 capex against 2025: 78.7% higher
equipment on the books divided by one year of depreciation: 2.9 years
cost and expenses against revenue: 2.60x
subscriber-years needed to match one year of capex: 3,052,083,333
The first four lines are legitimate ratios, and each answers a question someone actually asked. Revenue as a share of the 2026 capex puts OpenAI's entire 2025 revenue at 1.78% of the four hyperscalers' planned 2026 spending, which is a statement about scale rather than funding. The 78.7% says the 2026 guidance sits 78.7% above the 2025 figure, which is what the guidance claims. The 2.9 years divides equipment on the books by one year of depreciation, which is a crude payback time and nothing more. The 2.60x says OpenAI's cost and expenses ran at 2.6 times its revenue.
The two inputs behind that payback time are third-party estimates for the four quarters to March 2026: about $433.9 billion of property and equipment purchased, against about $149 billion of depreciation reported over the same period. They are estimates and they are used here as estimates.
The fifth line is arithmetically correct and analytically useless. Dividing a planned annual stock of spending by the price of a subscription yields 3,052,083,333 subscriber-years, a number with no referent: the four hyperscalers do not sell that subscription, subscriptions are not sold in whole years, and the spending is not funded from consumer plans. The units cancel, which is exactly why the line passes inspection. It is the trap, not a finding.
Classify The Number Before Dividing It
One question decides what any division can mean: is the number a flow, a stock, or an intention?
flowchart TD
    N[A number found in a filing or a report] --> Q{Flow, stock, or intention?}
    Q -->|Per year or per quarter| F[Flow: revenue, cost, capex guidance, cash burn]
    Q -->|At a date| S[Stock: equipment on the books, equity funded]
    Q -->|A stated plan| I[Intention: letter of intent, purchase commitment]
    F --> F2[Divide by another flow over the same period]
    S --> S2[Divide by a flow only to read a duration]
    I --> I2[Reconcile against funded amounts, never add to cash]
Flows divide by flows measured over the same twelve months. Stocks compare with stocks taken at the same date, and a stock divided by a flow produces a duration, which is why the depreciation line survives and the subscriber-year line does not. Intentions support one operation only: reconciliation against what has actually been funded. An intention added to cash is not arithmetic; it is a description of a hope.
The Four Ways This Ratio Gets Misused
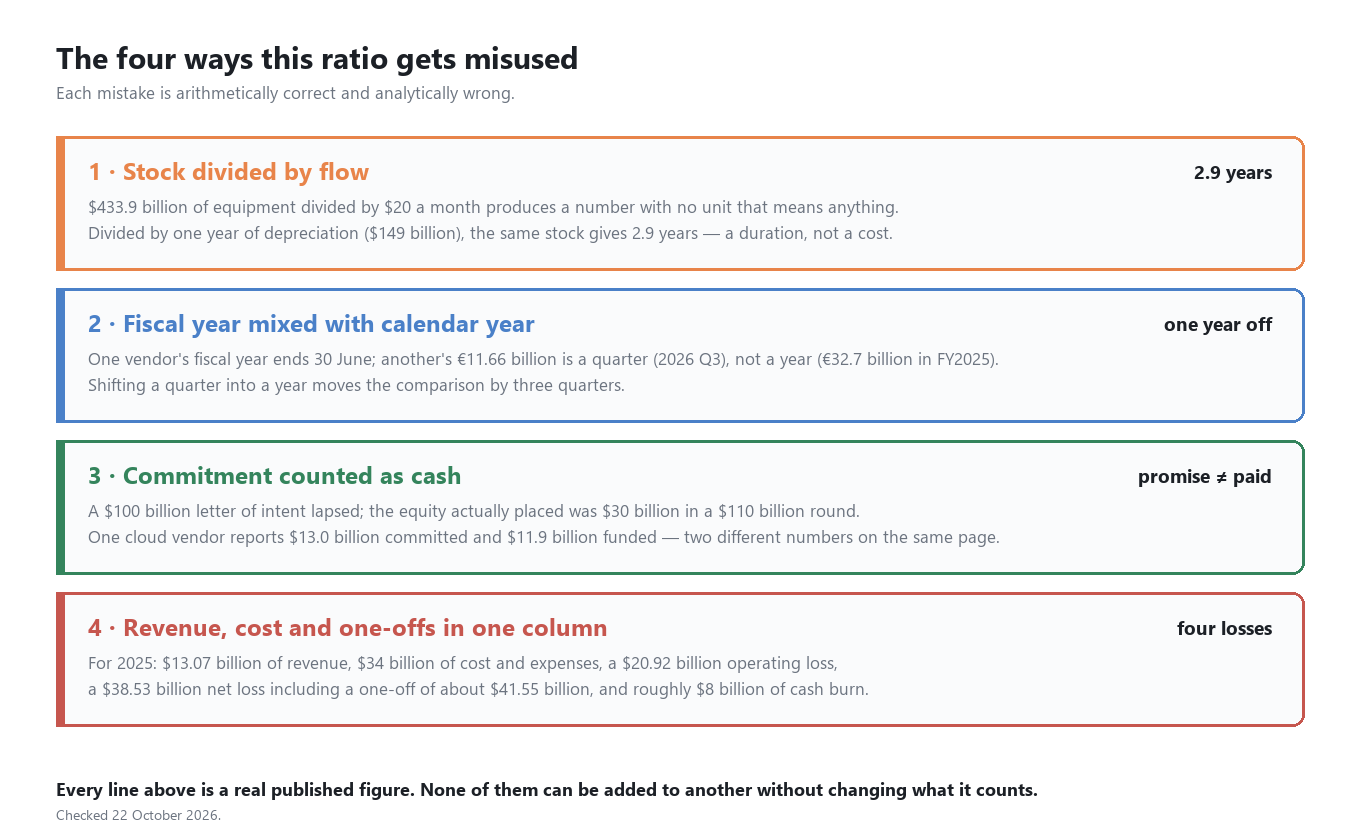
Stock divided by flow. The $732.5 billion median is an annual plan and the $240 is a price, so dividing the first by the second yields a subscriber count that reads like a population and is not one. The same error reversed turns a stock of equipment into a monthly fee, producing a per-subscriber hardware cost that no company has ever reported.
Fiscal year mixed with calendar year. One of the four hyperscalers closes its books on 30 June, so its 2026 is a different twelve months from the other three. A cleaner case sits at ASML: €11.66 billion of net sales in 2026 Q3 (company earnings release, 14 October 2026) against €32.7 billion for FY2025 (company earnings release). A quarter and a year are not comparable, and the frequently repeated claim that ASML booked €11.6 billion in 2025 is that quarter shifted into the wrong year.
Commitment counted as cash. A $100 billion letter of intent announced in September 2025 lapsed in February 2026; $30 billion of equity was placed instead, inside a $110 billion round. The same distinction appears in a filing: $13.0 billion committed against $11.9 billion funded as of 30 June 2026 (Microsoft FY2026 Form 10-K). One figure is a promise, the other is a transfer, and they do not add.
Revenue, cost and one-offs in one column. OpenAI's 2025 shows $13.07 billion of revenue, $34 billion of cost and expenses, a $20.92 billion operating loss, a $38.53 billion net loss that includes a one-off of about $41.55 billion from the conversion to a for-profit entity, and roughly $8 billion of cash burn (press report citing sources, checked on 22 October 2026). Five figures, five definitions. Subtracting the one-off from the net loss, or reading the operating loss as the cash burn, mixes them.
What I Got Wrong First
Four corrections, in the order they happened.
I adopted the $24 price. The reported rise to $24 on 15 June 2026 went into the draft as a settled fact. Comparing the sources showed they disagreed about the effective date and about whether existing subscribers were covered. A price whose date is contested cannot anchor a per-year figure, so $20 stands with its third-party label and the $24 is out.
I checked the 70% claim. I considered whether a large share of one cloud vendor's AI revenue came from OpenAI. The denominator was not a reported segment, and I found no reliable source for the number, so I leave it out.
I started a cumulative capex total. I tried to sum one vendor's capital expenditure across several fiscal years, using the $261.3 billion and $270 billion figures that circulate. Neither traced to a filing, and the vendor's own fiscal-year boundary makes a multi-year sum a choice rather than a fact. The total was rejected.
I began treating two related figures as matching sides of one transaction. Microsoft's $24.1 billion of FY2026 revenue from commercial arrangements with OpenAI (company 10-K) and the roughly $17.2 billion OpenAI reportedly paid Microsoft in calendar 2025 (audited document obtained by the press) differ in period and scope. They show a commercial relationship, but do not establish that the figures are equal-and-opposite entries for the same transactions; I keep them separate.
What This Cannot Tell You
Four limits, and each is a boundary rather than a gap to be filled later.
Nothing published splits the $20. No public document allocates a subscription's cost across memory, packaging, compute and software. The subscription buys a bundle, and the bundle has no published bill of materials.
Chip unit prices are not published. The per-card figures in circulation are third-party disassembly estimates rather than company disclosures, so a cost floor per token cannot be assembled from them.
The depreciation life is a choice. Investors have argued publicly that chips amortised over five to six years have an economic life of two to three, and a media estimate puts the cumulative effect on reported profit in the billions. Every per-year figure inherits that assumption, including the 2.9 years above.
Several inputs are estimates. The property and equipment total, the depreciation reported against it, and the price of the subscription itself are third-party while the primary pages are unavailable, and the capex aggregate is guidance rather than a result.
Frequently Asked Questions
Can A Subscriber Work Out What One $20 Payment Pays For
Not from public documents. Nothing published allocates a subscription's cost across memory, packaging, compute and software, so there is no line to point at.
What can be done is the opposite comparison. $20 buys a fixed monthly allowance; the same usage bought at published per-token prices is a measurable quantity. That compares two prices, not a payment with a cost.
Why Is The Capex Figure A Range
Because each company published its own number under its own definition: Amazon about $220 billion of cash capital expenditure, Alphabet $195–205 billion including finance leases, Meta $130–145 billion including finance leases, and Microsoft a fiscal-year cash figure of $115.95 billion, up 80% year on year.
Adding those definitions gives $720–745 billion, and the median of $732.5 billion is the middle of a range of ranges. It was chosen for the script, not reported by anyone.
Does Capex Equal Cash Spent
No. Guidance is a plan, and its parts are not the same kind of money: some vendors count finance leases, one counts only cash, and the aggregate treats them as one column.
The difference between spending and its accounting shadow is the depreciation lag. About $433.9 billion of property and equipment purchased over the four quarters to March 2026, against about $149 billion of depreciation reported in the same period, means roughly three dollars recorded as assets for every dollar depreciated (third-party estimate).
Does The Fiscal-Year Problem Affect The Numbers Here
Yes, in one of the four. Microsoft's fiscal year ends 30 June, so its 2026 covers different months from the other three, which means the $720–745 billion aggregate is a scale estimate and not a comparable accounting total.
The same problem produced the ASML error described above, where a 2026 third-quarter figure was read as a full 2025 figure.
What Is A Subscriber-Year, And Why Does It Mean Nothing
A subscriber-year is one subscription held for twelve months, or $240 of revenue. Multiplied by 3,052,083,333 it reproduces $732.5 billion, which is why the arithmetic passes and the units cancel.
It means nothing because the two sides are not in the same market. The four hyperscalers fund their spending from their own cash flow, debt and equity, not from OpenAI subscriptions, and OpenAI's entire 2025 revenue is 1.78% of the same capex figure.
Which Figures Can A Reader Check Independently
The ones with a filing behind them: the Microsoft Form 10-K lines for $24.1 billion of revenue from OpenAI commercial arrangements and for $13.0 billion committed against $11.9 billion funded, ASML's quarterly earnings releases, and the four earnings calls carrying the capex guidance.
The harder ones are third-party: the $20 price while OpenAI's pricing pages return 403, the property and equipment and depreciation totals, and the per-card cost estimates. Per-token prices are the fastest-moving checkable input and are published per model; Crazyrouter's Anthropic model page is one place where a current set can be read, and the vendor's own pricing page remains the primary record.
Why Not Use Revenue Instead Of Capex
The two answer different questions, and treating them as interchangeable hides the distinction: revenue measures what OpenAI sold; capex measures what four other companies plan to build.
OpenAI's 2025 revenue against that capex says the first is 1.78% of the second, which is a scale statement. OpenAI's cost and expenses against its own revenue is 2.60x, which is a different ratio with a different meaning. Neither substitutes for the other.
Sources and Method
- $20 per month for ChatGPT Plus: third-party figure, because OpenAI's pricing pages returned HTTP 403; checked 22 October 2026.
- $20 per month for Claude Pro, and $100 and $200 for Claude Max: Anthropic's official pricing page, which excludes Console API usage; checked 22 October 2026.
- $240 per subscriber per year: arithmetic on the published monthly price.
- $720–745 billion of 2026 capital expenditure guidance, median $732.5 billion, against about $410 billion for 2025: company guidance aggregated by the press and brokers, an approximation rather than an accounting total; checked 22 October 2026.
- $13.07 billion of revenue, $34 billion of cost and expenses, a $20.92 billion operating loss, and a $38.53 billion net loss including a one-off of about $41.55 billion: audited document obtained by the press, independently verified by the Financial Times, not published by OpenAI; checked 22 October 2026.
- About $8 billion of 2025 cash burn: press report citing sources; checked 22 October 2026.
- About $433.9 billion of property and equipment and about $149 billion of depreciation, four quarters to March 2026: third-party estimate; checked 22 October 2026.
- €11.66 billion in 2026 Q3 and €32.7 billion for FY2025: ASML earnings releases; checked 22 October 2026.
- $24.1 billion of FY2026 revenue from commercial arrangements with OpenAI, $13.0 billion committed and $11.9 billion funded, and the 30 June fiscal year end: Microsoft FY2026 Form 10-K, published 29 July 2026.
- The $100 billion letter of intent, its lapse in February 2026, the $30 billion of equity placed in a $110 billion round, and the roughly $17.2 billion OpenAI paid Microsoft in 2025: company announcements and press reports; checked 22 October 2026.
- The five-to-six-year depreciation claim against a two-to-three-year economic life: an investor argument reported by the press, with no regulatory or audit conclusion; checked 22 October 2026.
- The per-token prices behind the price comparison: official vendor pricing pages except where noted, checked 22 October 2026.
Every figure above is a company filing, an audited document obtained by the press, a third-party estimate or a press report, labelled at first mention in the text, and each was checked on 22 October 2026. The script was run on that date; the prices and the filings behind it change.
Comments(0)
Join the discussion by logging into your account.
No comments yet. Be the first to comment!