
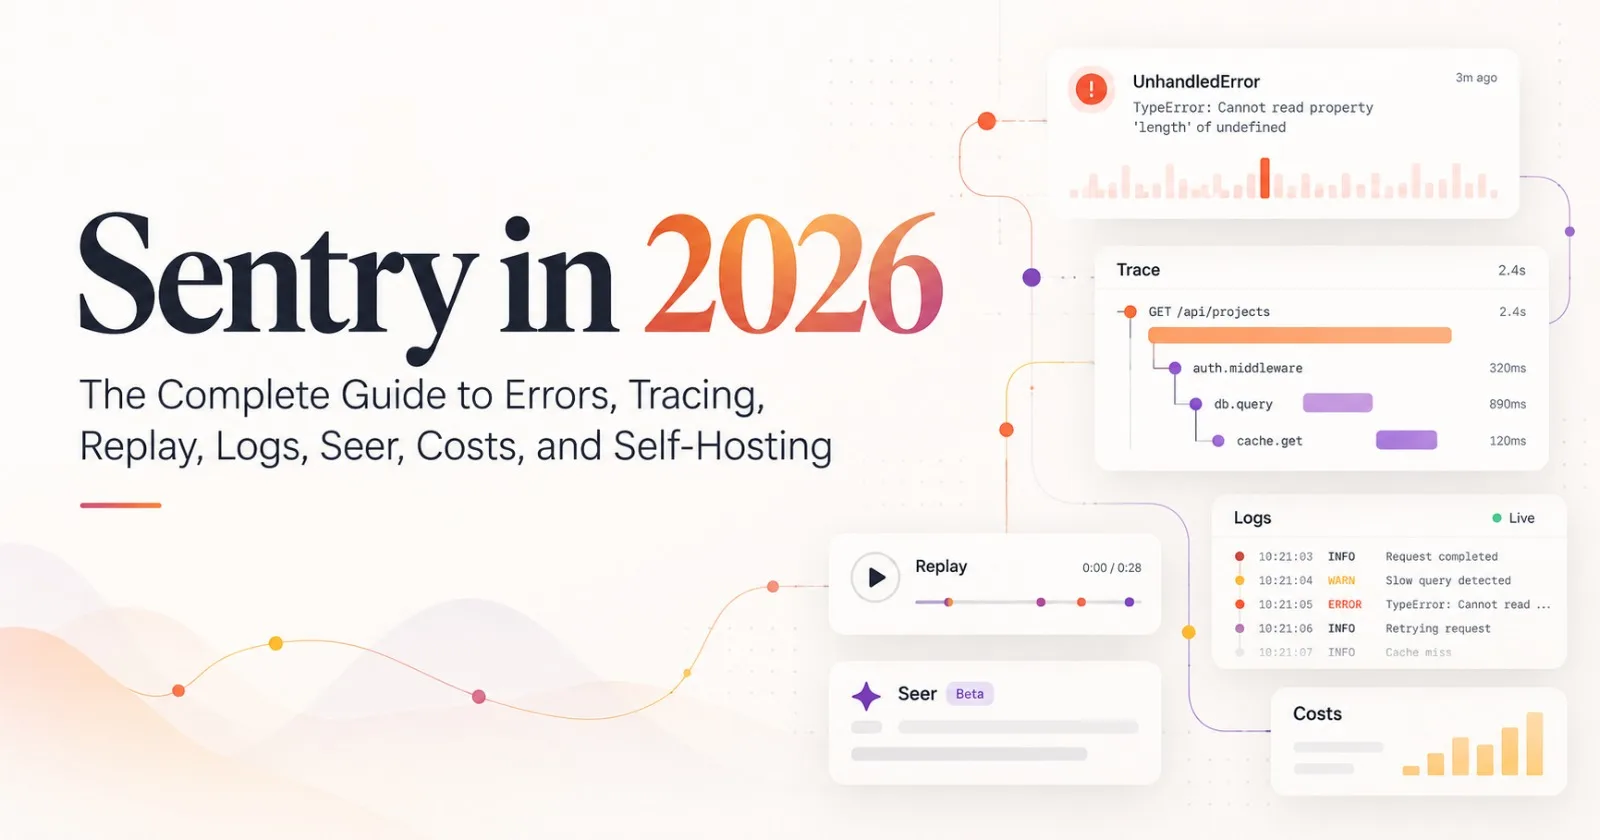
Sentry started as an error logger and is now a full application monitoring platform. It covers errors, distributed tracing, session replay, logs, application metrics, profiling, cron and uptime monitors, mobile size analysis, and an AI debugging agent called Seer. This guide is written so you can build with it. It opens with a working Next.js and NestJS setup, then explains each product, the billing math, the privacy defaults, and how self-hosting really works.
Everything here was checked against Sentry's own documentation, pricing page, and release notes on September 29, 2026. The timing matters. The Sentry JavaScript SDK shipped version 11.0.0 on September 23, 2026, and it changes defaults for data collection, tracing, logs, and stack traces. Where one documentation page and the v11 migration guide disagree, this post says so instead of picking silently.
If you only do five things after reading, do these. Install the SDK with the wizard. Set explicit trace and replay sample rates. Set an explicit dataCollection baseline. Upload source maps from CI. Put a spend cap and spike protection on the organization before your first busy deploy.
Part 1: Get it running in one sitting
Next.js (App Router)
The Next.js guide requires Next.js 14 or newer and Node.js 20.19.0 or newer. The wizard detects your project, asks which features you want, and writes the configuration for every Next.js runtime.
npx @sentry/wizard@latest -i nextjsThree kinds of files matter. instrumentation-client.ts runs in the browser and is the only file where Session Replay is configured. sentry.server.config.ts and sentry.edge.config.ts initialize the Node.js and edge runtimes. instrumentation.ts registers the server files with Next.js and exports onRequestError, which is how server rendering errors reach Sentry.
// instrumentation-client.ts
import * as Sentry from "@sentry/nextjs";

Sentry.init({
  dsn: process.env.NEXT_PUBLIC_SENTRY_DSN,
  tracesSampleRate: process.env.NODE_ENV === "development" ? 1.0 : 0.1,
  replaysSessionSampleRate: 0.1,
  replaysOnErrorSampleRate: 1.0,
  integrations: [Sentry.replayIntegration()],
});

export const onRouterTransitionStart = Sentry.captureRouterTransitionStart;
// sentry.server.config.ts (sentry.edge.config.ts looks the same)
import * as Sentry from "@sentry/nextjs";
Sentry.init({
dsn: process.env.SENTRY_DSN,
tracesSampleRate: process.env.NODE_ENV === "development" ? 1.0 : 0.1,
});// instrumentation.ts
import * as Sentry from "@sentry/nextjs";
export async function register() {
if (process.env.NEXT_RUNTIME === "nodejs") {
await import("./sentry.server.config");
}
if (process.env.NEXT_RUNTIME === "edge") {
await import("./sentry.edge.config");
}
}
export const onRequestError = Sentry.captureRequestError;The build side is a wrapper around your Next.js config. It uploads source maps and can add a tunnel route so browser events travel through your own domain, which avoids ad blockers. That also means the tunnel traffic passes through your own deployment. I read the organization and project from environment variables so the same file works everywhere, while the wizard writes literals.
// next.config.ts
import type { NextConfig } from "next";
import { withSentryConfig } from "@sentry/nextjs/config";

const nextConfig: NextConfig = {};

export default withSentryConfig(nextConfig, {
  org: process.env.SENTRY_ORG,
  project: process.env.SENTRY_PROJECT,
  authToken: process.env.SENTRY_AUTH_TOKEN,
  tunnelRoute: "/sentry-tunnel",
  silent: !process.env.CI,
});
One import changed in v11. The Next.js migration guide moves withSentryConfig from @sentry/nextjs to @sentry/nextjs/config, and the SentryBuildOptions type moved with it. Older tutorials still show the old import, so a missing-export build error after upgrading usually means this line. On v10 or earlier, import from @sentry/nextjs. Also add app/global-error.tsx so React rendering errors are captured, as the docs recommend.
The config above reads SENTRY_AUTH_TOKEN from the environment, so it must exist wherever the build runs. On Vercel, that means a project environment variable that is available at build time, not only at runtime. Without a token, source maps cannot be uploaded, so production stack traces stay minified.
Two more v11 changes matter on Vercel. The default environment is now VERCEL_TARGET_ENV (production, preview, or your custom name) instead of vercel-production and vercel-preview, so alert rules and saved searches using the old names will stop matching unless you set environment yourself. Also, tunnelRoute requests now pass through your Next.js middleware. If middleware blocks unauthenticated traffic, keep a fixed string route like the one above and exclude it in the middleware matcher.
NestJS
The NestJS guide installs @sentry/nestjs, initializes it in a file named instrument.ts, and requires that file to be imported before anything else. Then you add SentryModule.forRoot() to your root module.
// instrument.ts
import * as Sentry from "@sentry/nestjs";

Sentry.init({
  dsn: process.env.SENTRY_DSN,
  tracesSampleRate: process.env.NODE_ENV === "production" ? 0.1 : 1.0,
});
// main.ts
import "./instrument"; // must be first
import { NestFactory } from "@nestjs/core";
import { AppModule } from "./app.module";
async function bootstrap() {
const app = await NestFactory.create(AppModule);
await app.listen(3000);
}
bootstrap();Error capture needs one more decision, because Sentry only captures unhandled exceptions that no filter caught. HttpException and its subclasses are not captured by default, since Nest treats them as control flow. If you have no global catch-all filter, register SentryGlobalFilter before your other filters. If you do have one, decorate its catch() method with @SentryExceptionCaptured().
// app.module.ts
import { Module } from "@nestjs/common";
import { APP_FILTER } from "@nestjs/core";
import { SentryModule, SentryGlobalFilter } from "@sentry/nestjs/setup";

@Module({
  imports: [SentryModule.forRoot()],
  providers: [{ provide: APP_FILTER, useClass: SentryGlobalFilter }],
})
export class AppModule {}
The current NestJS guide lists Node.js 20.19.0 or above, with Node 22 needing 22.12 or higher and Node 23 needing 23.2 or higher, which matches the v11 migration guide. Some older copies of that page still say Node 18, so check which version of the docs you are reading.
Background jobs deserve special care. The NestJS docs warn that breadcrumbs from @Cron(), @Interval(), @OnEvent(), or BullMQ jobs can leak into unrelated HTTP request error events. Their fix is to wrap job handlers in Sentry.withIsolationScope(). BullMQ also catches processor errors and marks the job failed, so nothing reaches global handlers. The pattern below is mine, not the docs': isolate, trace, capture, then rethrow so BullMQ still records the failure.
import * as Sentry from "@sentry/nestjs";
import { Processor, WorkerHost } from "@nestjs/bullmq";
import { Job } from "bullmq";

@Processor("emails")
export class EmailProcessor extends WorkerHost {
  async process(job: Job) {
    return Sentry.withIsolationScope(() =>
      Sentry.startSpan(
        { op: "queue.process", name: `process ${job.queueName}` },
        async () => {
          try {
            await this.send(job.data);
          } catch (err) {
            Sentry.captureException(err);
            throw err;
          }
        },
      ),
    );
  }

  private async send(_data: unknown) {
    /* your work here */
  }
}
For scheduled work, the SDK ships a @SentryCron decorator that must be applied after Nest's @Cron decorator, otherwise the instrumentation does not work. It sends a check-in before and after each run, which is what Sentry Crons uses to detect missed and overrunning jobs.
import { Cron } from "@nestjs/schedule";
import { SentryCron } from "@sentry/nestjs";

export class DigestService {
  @Cron("0 * * * *")
  @SentryCron("hourly-digest", {
    schedule: { type: "crontab", value: "0 * * * *" },
    checkinMargin: 2,
    maxRuntime: 10,
    timezone: "UTC",
  })
  async run() {
    /* job body */
  }
}
Connect both sides with distributed tracing
Distributed tracing works by passing two HTTP headers between services, sentry-trace and baggage. The docs say that if you run JavaScript apps in the system, both headers must be on your CORS allowlist and must not be stripped by proxies, gateways, or firewalls.
The browser SDK does not add these headers to every request. By default it attaches them only to requests for localhost and to paths that start with /, per the CORS guide. A frontend calling an API on another origin needs that origin in tracePropagationTargets, and port numbers count as part of the origin.
sequenceDiagram
  participant B as Browser (Next.js client)
  participant N as Next.js server
  participant A as NestJS API
  participant S as Sentry
  B->>N: request with sentry-trace and baggage
  N->>A: fetch with the same trace headers
  N->>S: spans and errors, one trace id
  A->>S: spans and errors, same trace id
  B->>S: pageload span and linked replay
// instrumentation-client.ts: send trace headers to your API origin
Sentry.init({
dsn: process.env.NEXT_PUBLIC_SENTRY_DSN,
tracePropagationTargets: ["https://api.example.com", /^\/api\//],
});// NestJS main.ts: let the headers through CORS
app.enableCors({
origin: ["https://www.example.com"],
allowedHeaders: ["content-type", "authorization", "sentry-trace", "baggage"],
});Sampling is head-based. The originating service decides, and that decision travels in the headers to every downstream service, so a trace is either kept whole or dropped whole. If your API is public and receives traffic from services outside your organization, turn on strictTraceContinuation: true, which continues a trace only when it belongs to the same Sentry organization. The docs say the default can cause unwanted traces, increased billing, and skewed performance data when the caller is a third party.
Verify before you trust it
Throw a test error from a route and confirm three things in the Sentry UI: an issue with a readable stack trace, a trace that spans both services, and a log line that links to the trace. The Next.js wizard creates /sentry-example-page for this. Note that errors triggered from the browser developer console are sandboxed and will not be reported, so use a real page interaction.
Part 2: The mental model
An SDK sends envelopes to a project's ingest endpoint using a DSN. Sentry turns error envelopes into events, computes a fingerprint for each, and groups events with the same fingerprint into an issue. Events carry an environment (production, staging) and usually a release. Spans belong to traces. Logs and metrics are stored as attributed records that can join to traces and replays.
The hosted product and the self-hosted product share the same pipeline. The application architecture overview publishes a dependency graph that it calls simplified, redrawn here. Relay receives SDK traffic and puts it on Kafka. Snuba queries ClickHouse. PostgreSQL holds relational data. Symbolicator resolves native stack traces.
graph TD
  app[Your application with Sentry SDK] --> lb{Load balancer}
  lb -->|/api/0/envelope/| relay[Relay]
  lb -->|everything else| web[Sentry web]
  relay --> kafka[(Kafka)]
  relay --> redis[(Redis)]
  web --> snuba[Snuba]
  web --> memcached[(Memcached)]
  web --> postgres[(PostgreSQL)]
  web --> redis
  snuba --> kafka
  snuba --> redis
  snuba --> clickhouse[(ClickHouse)]
  web --> worker[Sentry worker]
  worker --> postgres
  worker --> redis
  worker --> memcached
  worker --> symbolicator[Symbolicator]
  symbolicator --> web
The Snuba documentation adds a useful detail: one Kafka topic named events feeds both errors and transactions, and an errors consumer writes to the ClickHouse errors table. Alerts on errors come from a subscription consumer that stays in lockstep with that main consumer by reading a commit log topic. You do not need this to use Sentry, but it explains why self-hosting is a real distributed system.
Part 3: Errors and issues
Grouping is the feature that makes Sentry usable at volume. The grouping docs state that all algorithm versions consider the fingerprint first, then the stack trace, then the exception, and finally the message. When a stack trace exists, grouping is effectively based on it, and only frames that the SDK marks as belonging to your application are used.
Each time Sentry changes the default grouping algorithm, it ships as a new version that applies only to new events, and a new project picks the latest version. That means two projects created a year apart can group the same bug differently. You can move an existing project under Issue Grouping settings, but expect new groups afterward. Open Issue Details and read "Event Grouping Information" at the bottom to see whether an event was grouped by fingerprint, stack trace, exception, or message.
For Next.js apps, one more detail helps. Sentry keeps built-in fingerprinting rules for noisy classes such as chunk load errors and hydration errors, and issues grouped that way show "Sentry Defined Fingerprint" in the same section.
When defaults group too much or too little, use fingerprint rules in the project's Issue Grouping settings. A rule has a matcher, an arrow, and a list of values. The first matching rule wins. Including {{ default }} refines the normal grouping instead of replacing it. These rules apply to error issues only, not to performance or replay issues.
# Group infrastructure failures into one issue
error.type:DatabaseUnavailable -> system-down
error.type:ConnectionError -> system-down

# Split one noisy error by transaction
error.value:"connection error: *" -> connection-error, {{ transaction }}

# Refine default grouping for one function
stack.function:"query_database" -> {{ default }}, {{ transaction }}
The docs warn that variables like {{ error.value }} and {{ message }} can produce poor groups when the values change frequently, so avoid fingerprinting on anything that contains IDs or timestamps. Use title="..." at the end of a rule when a custom group needs a readable name.
Issue triage builds on that. Ownership rules and code owners route issues to the right team, suspect commits point at the change that likely caused a regression, and the releases docs explain that an issue ID in a commit message resolves the issue once a release containing that commit exists. Monitors can also set assignees, though the monitor docs say assignees from ownership rules override them.
Part 4: Tracing and performance
Tracing records what a request did across services as a tree of spans. In v10 and earlier, an SDK held a whole trace in memory and sent one transaction when the root span ended. In v11, span streaming is the default: spans are sent in small batches as they finish, spans are no longer capped at 1000 per transaction, and transactions no longer exist as a concept. What used to be a transaction is now a service span with children.
That change breaks several things quietly, and TypeScript will not catch them. beforeSendTransaction and ignoreTransactions become no-ops. beforeSendSpan receives a new StreamedSpanJSON shape where description becomes name, data becomes attributes, and op moves to attributes['sentry.op']. Scope tags and extra no longer reach spans, so use Sentry.setAttribute() (available since 10.61.0) for anything you want to search on spans, logs, and metrics.
Span names are also now low cardinality. An HTTP server span is named GET /users/:id when a route is resolved, or just GET when it is not, and a database span becomes something like SELECT "User" instead of the full statement. The original detail moves to attributes such as url.full and db.query.text. Update any dashboard, alert, or filter that matched on the old names.
Sampling is where cost and visibility meet. The sampling docs offer a uniform tracesSampleRate or a tracesSampler function, and they recommend inheriting the parent's decision to avoid broken traces. In v11, tracesSampler and ignoreSpans run when a span starts, so match on attributes rather than names.
Sentry.init({
  dsn: process.env.SENTRY_DSN,
  tracesSampler: ({ attributes, inheritOrSampleWith }) =>
    inheritOrSampleWith(attributes["url.path"] === "/health" ? 0 : 0.1),

  // Drop health checks entirely. Ignoring a service span also drops its children.
  ignoreSpans: [
    { attributes: { "sentry.op": "http.server", "url.path": "/health" } },
  ],
});
If you cannot migrate filters yet, the migration guide offers a temporary escape hatch: set traceLifecycle: "static" to keep transaction mode, or set SENTRY_TRACE_LIFECYCLE=static in Node.js, Bun, Vercel Edge, or Cloudflare. It also says transaction mode exists only for backward compatibility and will be removed in a future major version, so treat it as temporary. In that mode, beforeSendSpan must be wrapped in Sentry.withStaticSpan() or it never runs.
Browser tracing adds Web Vitals. In v11, browserTracingIntegration adds the WebVitals integration automatically, INP is always sent as a Web Vital span, and soft-navigation vitals are on by default in stream mode on browsers that support the Soft Navigations API. If you filtered on the old report_event attributes, remove those filters.
Part 5: Session Replay
Session Replay records lightweight DOM event logs (clicks, scrolls, and mutations) rather than video, and Sentry's servers turn them into a video-like replay. By default it masks all text and blocks media such as images and video. It only runs in the browser, so you configure it in instrumentation-client.ts and nowhere else.
Sampling has two dials. replaysSessionSampleRate picks sessions to record fully. replaysOnErrorSampleRate covers sessions that were not sampled: the SDK keeps the last 60 seconds in memory, and if an error occurs and the on-error rate hits, it sends that buffer plus the rest of the session. Keep the on-error rate at 1.0, because those sessions carry the most debugging value.
Traffic volume | Session rate | Error rate |
|---|---|---|
High (100k or more sessions per day) | 0.01 | 1.0 |
Medium (10k to 100k per day) | 0.1 | 1.0 |
Low (under 10k per day) | 0.25 | 1.0 |
Per the session docs, a session ends after 15 minutes of user inactivity or after 60 minutes total, and a new session then starts based on your sample rates. Replay uses a web worker for compression, so a strict Content Security Policy needs worker-src 'self' blob:, and Safari 15.4 and older also needs child-src 'self' blob:. Canvas recording is opt-in through replayCanvasIntegration(), and the docs warn that canvas recordings have no PII scrubbing.
Two cost facts matter here. Every paid plan includes only 50 replays per month, per the pricing docs, and new users get 5,000 free replays per month for their first three months, according to the pricing page. Do not size your rates around the promotion. Size them around the 50 included replays plus your budget.
Part 6: Logs and Application Metrics
Sentry Logs are structured. You pass attributes and they become queryable columns. Logs work in the client, server, and edge runtimes of Next.js, and they are enabled by default in the current docs. Levels run from trace to fatal, and the fmt helper extracts template parameters as searchable attributes.
Sentry.logger.info("Checkout completed", {
  order_id: order.id,
  user_id: user.id,
  cart_value: cart.total,
  item_count: cart.items.length,
  duration_ms: Date.now() - startTime,
});

Sentry.logger.warn(Sentry.logger.fmt`Slow query for ${userId}`);
The docs recommend wide events over scattered thin logs: one comprehensive record per operation, with consistent snake_case attribute names, so a single query returns everything about an order or request. Logs automatically carry the environment, release, SDK version, trace and span IDs, and replay ID when present, which is what lets you jump from a log line to the trace and the replay.
Console and library integrations turn existing logging into Sentry logs. consoleLoggingIntegration() captures console.log, console.warn, and console.error. Pino needs SDK 10.18.0 or newer, Consola needs 10.12.0 or newer, and Winston needs 9.13.0 or newer. Use beforeSendLog to drop debug logs in production or strip sensitive attributes, and remember that logs larger than 1 MB are dropped.
Because v11 removes the enableLogs option, logs are captured whenever you call the logger API or add a logging integration. That is a billing risk if you attach the console integration to a chatty service. Each paid plan includes 5 GB of logs and 5 GB of application metrics, and additional usage of each costs $0.50 per GB on pay-as-you-go.
Application Metrics use three calls, and they share attributes with logs and spans.
Sentry.metrics.count("checkout.failed", 1);
Sentry.metrics.gauge("queue.depth", 42);
Sentry.metrics.distribution("api_latency", 187, { unit: "millisecond" });
In Node.js, the NodeRuntimeMetrics integration collects runtime health metrics automatically, per the NestJS guide. One v11 packaging detail: metrics moved out of the base CDN bundle and ship only in the *.logs.metrics bundles, so Sentry.metrics.* is a no-op elsewhere.
Part 7: Profiling
Tracing tells you which span was slow. Profiling tells you which function inside it was slow. In Node.js you install @sentry/profiling-node, whose version must exactly match your main SDK package, and add nodeProfilingIntegration(). It uses V8's CpuProfiler through a native add-on, so it does not run on Deno or Bun.
Profiling has two mutually exclusive lifecycle modes. In trace mode the profiler starts when a span is active and stops when none are. In manual mode you call Sentry.profiler.startProfiler() and stopProfiler() yourself. profileSessionSampleRate decides once, at SDK init, whether the whole process is profiled, which suits services you deploy many times.
const { nodeProfilingIntegration } = require("@sentry/profiling-node");

Sentry.init({
  dsn: process.env.SENTRY_DSN,
  integrations: [nodeProfilingIntegration()],
  tracesSampleRate: 0.1,
  profileSessionSampleRate: 0.2,
  profileLifecycle: "trace",
});
The v11 migration guide removes the legacy per-transaction profiling options such as profilesSampleRate in favor of this session-based model. Profiling is available only through pay-as-you-go. Continuous profile hours cost $0.0315 per hour and UI profile hours cost $0.25 per hour, so one process profiled around the clock for a 30-day month is 720 hours, or $22.68 continuous versus $180.00 at the UI rate.
The docs also flag one runtime knob. By default the V8 profiler uses eager logging, which makes startProfiler fast but adds constant CPU overhead. Setting SENTRY_PROFILER_LOGGING_MODE=lazy avoids the constant overhead at the price of slower start calls, which the docs say can take a few hundred milliseconds. Test this before rolling profiling into a high-throughput service.
Part 8: Monitors and alerts
Sentry's newer model separates two ideas. Monitors decide when errors and performance problems become issues, and they can set priority, auto-resolve rules, and assignees. Alerts and integrations decide who gets notified and what happens next. New projects get two default monitors: an Issue Stream Monitor for new issues of all types and an Error Monitor based on grouping rules.
Metric Monitors track thresholds on errors, spans, logs, releases, and application metrics. You choose a fixed threshold, a percentage change, or dynamic anomaly detection. Use fixed thresholds when you know what bad looks like, such as a crash rate above 1 percent or a key transaction slower than 500 ms. Use dynamic thresholds for seasonal traffic or fast-growing apps, where a fixed number needs constant retuning.
Cron monitoring answers a question logs cannot: did the job run at all? A monitor takes a schedule, a check-in margin (the grace period in minutes), a maximum runtime, and optional failure and recovery thresholds. Missed and overrunning jobs create issues tagged with the monitor slug. Crons limits check-ins to 6 per minute per monitor environment, per the Crons docs.
// Wrap any job without a framework decorator
Sentry.withMonitor(
  "nightly-export",
  async () => {
    await runExport();
  },
  {
    schedule: { type: "crontab", value: "0 2 * * *" },
    checkinMargin: 5,
    maxRuntime: 30,
    timezone: "UTC",
    failureIssueThreshold: 2,
    recoveryThreshold: 1,
  },
);
Uptime monitoring checks a URL over HTTP from Sentry-managed infrastructure. The uptime docs list intervals of 1, 5, 10, 20, and 30 minutes or 1 hour. A check must return a 2xx, redirects are followed, and failure tolerance defaults to three consecutive failures. At a 5 minute interval that means an issue after 15 minutes of continuous downtime, so tighten the interval or the tolerance for critical endpoints.
Uptime checks also join your traces. Sentry adds a sentry-trace header to the request, so a backend with a Sentry SDK continues the trace and you can see related errors when downtime is detected. Error tracing is on by default, while span tracing stays off until you enable the Allow Sampling option on the monitor.
On cost, the uptime.request spans that Sentry creates are free and do not count against your span quota. The tracing page also says errors and spans captured during checks are billed as regular events, so treat your own SDK's spans as billable. If the URL sits behind a firewall, allow the SentryUptimeBot user agent through.
Part 9: Releases, source maps, and release health
A release is a version of your code deployed to an environment. If you never announce one, Sentry creates the release entity the first time it sees an event with that release ID, but the releases docs recommend telling Sentry before events arrive because it unlocks more features. Associating commits enables suspect commits and lets you resolve issues from commit messages.
Sentry.init({
  dsn: process.env.SENTRY_DSN,
  release: process.env.SENTRY_RELEASE, // for example "[email protected]+abc1234"
  environment: process.env.NODE_ENV,
});
Source maps turn minified frames back into your code. For Next.js, withSentryConfig plus SENTRY_AUTH_TOKEN uploads them at build time. For NestJS, the docs point to npx @sentry/wizard@latest -i sourcemaps. Release health then reports crash-free sessions, crash-free users, and adoption per release, which makes a bad deploy visible within minutes of rollout.
v11 changes two browser session defaults that affect those numbers. Sessions hit by an uncaught error are now recorded as unhandled instead of crashed, and the browser session lifecycle defaults to page, so a session starts on page load and is not renewed on navigation. The migration guide says to expect crash-free rates to shift, so re-baseline any alert built on them.
Also note the new stack trace default. captureMessage() events and non-Error values passed to captureException() now attach a synthetic stack trace. Sentry groups events with and without stack traces differently, so you may see new issue groups, and a captureMessage() call marks the current session as errored. For purely informational output, send a log instead.
Part 10: Seer, the MCP server, and AI-era features
Seer is Sentry's AI debugging agent. It uses issue context, tracing data, logs, and profiles, plus your repository, to do four jobs: AI code review on pull requests, root cause analysis on incoming issues, pull request creation for fixes, and delegation to external coding agents. The docs describe setup through the GitHub integration and note that Seer works only with cloud GitHub.
There is a source host discrepancy worth checking. Sentry's automated debugging page lists GitHub, GitLab, Bitbucket, and Azure DevOps, and the pricing docs explain how GitLab contributors are counted, while the Seer setup page describes GitHub. Confirm your host in Seer settings before you plan around it, and note that AI code review is documented as GitHub only.
Autofix can run automatically. Per Sentry's self-healing workflow cookbook, automation triggers on issues with 10 or more events, seen in the last 14 days, and a sufficient fixability score, and you can tune those criteria. Seer can hand its analysis to Cursor Cloud Agents or Claude Code through the coding agent integrations, and Sentry also offers a Seer Agent you can chat with about your application data.
Seer is billed separately from everything else: $40 per active contributor per month, where an active contributor made two or more pull requests to a Seer-enabled repository in the billing cycle, per the pricing docs. It does not draw from your pay-as-you-go budget. The docs also state that Seer does not use your application data, error information, or source code to train AI models.
The Sentry MCP server lets your own coding assistant query production issues. Sentry hosts a remote server at https://mcp.sentry.dev/mcp with OAuth, and the docs count 16 or more tools. You can scope the URL to one organization or project, and the docs recommend project scoping when possible. Self-hosted Sentry uses the stdio transport with a user auth token that needs org:read, project:read, project:write, team:read, team:write, and event:write.
# Claude Code, scoped to one project (recommended)
claude mcp add --transport http sentry https://mcp.sentry.dev/mcp/{organizationSlug}/{projectSlug}

# Any MCP client that supports the add-mcp helper
npx add-mcp https://mcp.sentry.dev/mcp

# Self-hosted Sentry over stdio
npx @sentry/mcp-server@latest --access-token=TOKEN --host=sentry.example.com
The MCP docs describe MCP and Seer as complementary: MCP brings Sentry context into your model, while Seer is purpose-built for deep issue analysis. The sentry-mcp repository also documents a Sentry-Bearer authorization header for clients that need to pass a Sentry token directly instead of using OAuth, and it notes that Seer features may be unavailable on self-hosted.
For teams that ship LLM features, the SDK guides list Agent Tracing for agents built with tools such as the Vercel AI SDK and LangChain, and MCP Monitoring for MCP servers. In v11, the AI integrations moved into @sentry/server-utils, browser support for AI integrations was dropped, and the 11.0.0 release notes list new Groq and Together AI integrations. Read the next part before enabling them, because prompts and outputs are now collected by default.
Part 11: Privacy and data collection in v11
This is the change most likely to hurt if you upgrade casually. In v10, sendDefaultPii was off by default and restrictive. In v11, sendDefaultPii is removed and dataCollection collects everything by default. The migration guide calls it a behavior change, not a rename. Sentry's blog post The Data Collection Control Panel explains the reasoning.
Category | v10 default | v11 default |
|---|---|---|
| false | true |
| not collected | true |
| request and response, PII scrubbed | request and response |
| not collected (size only) | all request and response |
| true | true |
| inputs and outputs not collected | inputs and outputs collected |
| false | true |
| true | true |
| 7 | 5 |
Sentry still scrubs values whose keys look sensitive, such as auth, token, secret, and password. The guide says the match runs on the key name and calls it best effort: a credential in a field that is not named like one still reaches Sentry. If you handle health, payment, or children's data, set the baseline yourself. This is the docs' snippet for restoring v10 behavior.
Sentry.init({
  dsn: process.env.SENTRY_DSN,
  dataCollection: {
    userInfo: false,
    cookies: false,
    httpHeaders: {
      request: { deny: ["forwarded", "-ip", "remote-", "via", "-user"] },
      response: { deny: ["forwarded", "-ip", "remote-", "via", "-user"] },
    },
    httpBodies: [],
    urlQueryParams: { deny: ["forwarded", "-ip", "remote-", "via", "-user"] },
    genAI: { inputs: false, outputs: false },
    databaseQueryData: false,
    graphQL: { document: false, variables: false },
  },
});
Server-side data scrubbing is the second layer. If attributes show [Filtered] in the UI, the Logs troubleshooting section says they were removed by server-side scrubbing, which you configure in project settings. Replay has its own layer of masking, network bodies in Replay are opt-in, and canvas recording has none, so treat each product as a separate privacy surface.
Part 12: What it costs, and how to control it
Sentry bills by data category, not by seat. The pricing page lists Developer at $0 for one user, Team at $26 per month, and Business at $80 per month when billed annually, with unlimited users on paid plans. Retention is a 30-day lookback on Developer and up to 90 days on Team and Business. Custom dashboards are limited to 10, 20, and unlimited respectively, and metric monitors to 20, 20, and 1,000.
Business adds unlimited dashboards, advanced quota management, and SAML plus SCIM support. Enterprise is quoted. Each paid plan includes the same base quota, and the billing docs list what that is and what overage costs on Team pay-as-you-go.
Category | Included on paid plans | Team pay-as-you-go overage |
|---|---|---|
Errors | 50k | $0.0003625 each from 50k to 100k, falling to $0.00015 above 20M |
Spans | 5M | $0.000002 each from 5M to 100M, then $0.0000018 |
Replays | 50 | $0.00375 each up to 5k, then lower tiers |
Logs | 5 GB | $0.50 per GB |
Application metrics | 5 GB | $0.50 per GB |
Attachments | 1 GB | $0.3125 per GB |
Cron monitors | 1 | $0.78 each |
Uptime monitors | 1 | $1.00 each |
Continuous profiling | none | $0.0315 per hour |
UI profiling | none | $0.25 per hour |
Seer | not included | $40 per active contributor per month |
Reserved volume is prepaid at a discount and expires at the end of each billing month. By my arithmetic the reserved error rates in the docs are exactly 20 percent below pay-as-you-go in the first band ($0.00029 versus $0.0003625). Business overage is steeper: the first error band is $0.0011125 on Business pay-as-you-go, about three times Team. Decide whether you need SAML before you pay for it.
The pay-as-you-go budget is shared across categories on a first-come, first-served basis. The docs are blunt about the failure mode: data sent after you exhaust reserved volume and your budget is dropped, and you lose monitoring for the rest of the billing cycle. A cap protects your bill, but a cap set too low creates a blind spot exactly when something is going wrong.
Here is a worked month for a small SaaS on Team, using only the rates above. All arithmetic is mine and assumes each tier applies only to volume inside its band, which is how I read Sentry's calculator. Verify against the calculator on the pricing page before you budget.
Line | Volume | Calculation | Cost |
|---|---|---|---|
Base plan | Team, billed annually | $26.00 | |
Errors | 300,000 | 50k at $0.0003625 plus 200k at $0.0002188 | $61.89 |
Spans | 20M | 15M over quota at $0.000002 | $30.00 |
Replays | 2,000 | 1,950 over quota at $0.00375 | $7.31 |
Logs | 20 GB | 15 GB over quota at $0.50 | $7.50 |
Cron monitors | 10 | 9 over quota at $0.78 | $7.02 |
Uptime monitors | 4 | 3 over quota at $1.00 | $3.00 |
Subtotal | $142.72 | ||
Seer | 3 contributors | 3 at $40 | $120.00 |
Total with Seer | $262.72 |
Notice that Seer costs almost as much as everything else combined in this scenario, because it is priced per contributor and not per event. Notice also that one noisy deploy can move errors from 300,000 to 3 million: the same arithmetic gives about $574 in error overage alone, up from $62. That is what the levers below are for.
Lever | Where | What it controls |
|---|---|---|
| SDK | Span volume, with 10 percent suggested for production in the Next.js docs |
| SDK (v11) | Removes high-frequency noise before it counts |
Replay session and error rates | SDK | Replay volume, using the traffic table above |
| SDK | Log gigabytes |
Error | SDK | Static error rate, but changing it needs a redeploy |
Rate limit per client key | Project Settings, Client Keys (DSN) | Caps error events per project |
Inbound data filters | Project Settings | Rejects matching events, such as a bad release, instead of accepting them |
Spike protection | Settings, Spike Protection | Drops events during abnormal spikes |
Pay-as-you-go budget | Subscription | Hard ceiling on overage spend |
Reserved volume | Subscription | About 20 percent cheaper for predictable volume |
Spike protection deserves special attention. It sets a threshold from each project's baseline and drops events once it is exceeded, so a bad deploy cannot consume the month's quota. It applies to errors, transactions or spans, and attachments. It is off during trials, its notifications are off by default, and enabling it per project needs Manager, Billing, or Owner permissions. The docs recommend combining it with per-key rate limits and a pay-as-you-go budget.
Part 13: Self-hosting
Self-hosting is real and well documented, but it is not a free version of the SaaS product. The self-hosted docs say the setup comes with no guarantees or dedicated support, and that the repository is a blueprint for how services connect. Unavailable on self-hosted: billing, spike protection, spend allocation, and Seer and other AI features, which the docs say are currently closed source. Some mobile symbolication and gaming platform support is also limited.
The minimum requirements are 4 CPU cores, 16 GB of RAM plus 16 GB of swap, and 20 GB of free disk, with 32 GB of RAM recommended. Docker 19.03.6 and Docker Compose 2.32.2 are required. The docs say self-hosted Sentry is heavy on disk I/O because it runs databases and brokers on one machine, and they suggest watching iowait: sustained values above 10 percent of CPU time probably mean the host cannot handle the load.
VERSION=$(curl -Ls -o /dev/null -w %{url_effective} https://github.com/getsentry/self-hosted/releases/latest)
VERSION=${VERSION##*/}
git clone https://github.com/getsentry/self-hosted.git
cd self-hosted
git checkout ${VERSION}
./install.sh
docker compose up --wait   # login page on http://127.0.0.1:9000
For production, the docs recommend a dedicated load balancer with TLS termination in front, a health check against /_health/, and updating system.url-prefix in config.yml. They state plainly that this design uses single nodes for every service including Kafka, and that they offer no guidance on scaling beyond it. For air-gapped installs, they recommend SENTRY_AIR_GAP = True, and the anonymous beacon can be disabled with SENTRY_BEACON = False.
Compatibility matters if you use v11. The JavaScript SDK v11 requires self-hosted Sentry 26.4.2 or higher, and lower versions may work but are unsupported. Debian and Ubuntu are preferred distributions, RHEL-family systems have known installation issues, and Alpine is unsupported. If you would rather not run Kafka and ClickHouse, the honest answer is often to stay on SaaS and control cost with the levers above.
Part 14: Licensing and history
Sentry's core is licensed under the Functional Source License. Per Sentry's self-hosted docs, it becomes Apache 2.0 after two years and is practically open source before that, except for competitors. You can deploy it anywhere, including inside an enterprise, but you cannot sell a deployed instance as an offering or use the FSL-licensed code to compete directly with Sentry.
The license drew criticism. TechCrunch reported that Thierry Carrez, general manager of the Open Infrastructure Foundation and then vice chair of the Open Source Initiative, criticized Sentry as one more company that built its name on open source and then moved away from that model. Sentry's own docs say Fair Source is not under the OSI umbrella. That is the accurate framing: source available now, Apache 2.0 after two years.
On history, Sentry's licensing announcement says the project began in 2008 as an unlicensed, 71-line Django plugin, was published under BSD-3 the next year, and moved to the Business Source License ten years later. In a First Round podcast, co-founder David Cramer traces the first code to a question in a Django IRC channel.
Sentry's Series E press release reports $90 million raised on May 4, 2022, bringing total funding to $217 million at a valuation above $3 billion. Founding dates differ by source: Tech Startups says 2012 and names Chris Jennings and David Cramer, while Tracxn lists 2011, so I avoid a precise year.
Part 15: Local development and smaller features
Spotlight is Sentry for development. Run npx @spotlightjs/spotlight and it serves a web UI on http://localhost:8969 through a local sidecar, receiving a copy of the events your SDK produces so you can debug in real time. The same CLI can stream events to your terminal with spotlight tail, wrap a command with spotlight run, and start an MCP server with spotlight mcp so an AI coding assistant can read your local telemetry. Enable it only in development.
The rest of the surface is smaller but useful. Size Analysis breaks down mobile app build size and includes 100 builds per billing period, and Mobile Builds Monitors can flag builds that cross an absolute or relative size threshold. User Feedback appears as a feature row in the pricing comparison, and the SDK exposes Sentry.sendFeedback(). Custom dashboards are capped at 10, 20, or unlimited by plan, and cross-project issues and anomaly detection are also listed there, so check which plan column includes them. Attachments carry their own 1 GB quota.
Part 16: Where Sentry fits, and where it does not
Sentry is strongest when the question is "what broke, for whom, and in which commit." Its issue grouping, releases, suspect commits, replay, and traces sit in one place, and the SDKs are the product's distribution. It is a developer tool first. If you need host-level infrastructure metrics, network telemetry, or long-term log archives for compliance, plan on another system beside it, because Sentry's logs and metrics are application-side and standard plan retention is up to 90 days.
On OpenTelemetry, v11 changes the relationship. By default the SDK no longer registers an OpenTelemetry tracer provider and ignores spans created through @opentelemetry/api. skipOpenTelemetrySetup is replaced by enableOpenTelemetrySetup, which is off by default except on the Next.js and SvelteKit SDKs. If you run your own OTel pipeline, leave Sentry tracing off and add openTelemetryIntegration() so errors and logs link to your traces.
Cost predictability is the recurring complaint. Because each category has its own quota and overage rate, a spike in one category can surprise you. Several vendor blogs make this point, but most are written by competitors, so weigh them accordingly. The official levers, the spend cap, and spike protection are the reliable answer, and they are all in the docs you just read.
Part 17: Upgrade checklist for JavaScript SDK v11
The migration guide recommends upgrading to the latest 10.x release first, because most of what v11 removes is already deprecated there. The table below summarizes the changes most likely to bite, all from the v10 to v11 migration guide and the 11.0.0 release notes.
Change | What breaks | Action |
|---|---|---|
Node.js 20.19.0 minimum (22.12 or higher on 22, 23.2 or higher on 23) | Node 18 builds fail | Upgrade the runtime, including Dockerfiles and CI images |
| Far more data sent by default | Set an explicit baseline |
Span streaming default |
| Move to |
Low-cardinality span names and consolidated ops | Filters, alerts, dashboards keyed on names or ops | Rewrite them using attributes |
Tags and extra not applied to spans | Span searches lose fields | Use |
Logs and metrics on by default |
| Audit console integrations for volume |
| New issue groups, sessions marked errored | Prefer logs for informational messages |
Browser session changes |
| Re-baseline crash-free alerts |
Legacy profiling options removed | Old profiling config ignored | Use |
Package changes |
| Update imports |
| Integration lookups by name fail | Update references |
Self-hosted 26.4.2 or higher | Older servers unsupported | Upgrade self-hosted first |
| Build fails on the old import | Update |
Vercel default environment lost its prefix | Alerts and searches on | Update them or set |
Tunnel requests run through middleware | Sentry events blocked by auth middleware | Exclude the fixed tunnel path in the |
Removed | Options deprecated in 10.30.0, such as | Move to |
| Sentry skips init and warns | Use |
| Targets that relied on casing may match more | Narrow the target with a path |
Safari 14 and TypeScript below 5.0.4 | Unsupported | Check browserslist and toolchain |
Part 18: Production checklist
Area | Do this | Why |
|---|---|---|
Setup | Use the wizard, then commit the generated files | Runtime coverage across client, server, edge |
Source maps | Set | Readable stack traces |
Privacy | Set | v11 collects everything by default |
Sampling | Set trace and replay rates; keep on-error replay at 1.0 | Cost control without losing failures |
Tracing | Allow | Connected traces |
Public APIs | Enable | Stops third-party traces inflating billing |
Background jobs | Wrap in | Clean breadcrumbs, real failures |
Scheduled work | Add crons check-ins | Detect jobs that never ran |
Availability | Add uptime monitors with sensible tolerance | External view of downtime |
Spend | Set a PAYG budget, enable spike protection, add per-key rate limits | Bounded bills, no blind spots |
Ownership | Configure ownership rules and code owners | Issues reach the right people |
Releases | Send release and environment; associate commits | Regressions and suspect commits |
Sources checked on September 29, 2026
Source | Used for |
|---|---|
Plan prices, quotas, retention, dashboard and monitor limits | |
Per-category rates, PAYG behavior, Seer pricing | |
Wizard, config files, | |
| |
Data collection, span streaming, defaults, package changes | |
Import move, Vercel environment default, tunnel and middleware | |
11.0.0 release date and breaking change list | |
Masking defaults, sampling, session rules, CSP | |
Logger API, integrations, limits | |
Lifecycle modes, native add-on, flags | |
Check-ins, decorator, rate limits | |
Monitor types, uptime behavior | |
Issue grouping and rule syntax | |
Spike behavior and limits | |
Seer features, automation criteria | |
MCP docs and sentry-mcp | MCP server setup and auth |
Requirements, limits, service graph | |
License terms and criticism | |
Sentry Series E press release, First Round podcast, Tech Startups, Tracxn | Funding, origin story, and the founding-year discrepancy |
Closing
Sentry rewards teams that treat it as an engineered system rather than a checkbox. The setup takes an afternoon. The decisions that matter come after: sample rates, data collection, ownership, spend caps, and which category of data is worth paying for. With v11 arriving days ago, the safest path is to upgrade deliberately, set your privacy baseline first, and re-baseline alerts that depended on transaction names and session status.
Comments (0)
Join the discussion by logging into your account.
No comments yet. Be the first to comment!