
A paragraph can explain a request path. A diagram can show the whole path at once: where the request starts, which services handle it, and what happens when something fails.
Mermaid lets you describe that diagram as text. Because the source stays in your article, you can revise a label or add a step without opening a separate drawing app or replacing an exported image. ZyVOP previews Mermaid blocks in the editor; on a published article page, the browser renders the block as an SVG diagram.
Start with a question a diagram can answer
Before writing Mermaid syntax, decide what the reader needs to understand. A useful diagram usually answers one focused question:
What happens after a request reaches the API?
Which steps run when a deployment fails?
How do services exchange events?
Which states can an order move through?
Avoid trying to map an entire product in one diagram. Choose one flow or relationship, then use the surrounding article to explain decisions and exceptions.
For example, an incident response guide could use a flowchart to show the first decisions an on-call engineer makes:
flowchart TD
    Alert["Alert received"] --> Impact{"Customer impact?"}
    Impact -->|Yes| Mitigate["Reduce or stop impact"]
    Impact -->|No| Investigate["Check logs and recent changes"]
    Mitigate --> Validate["Confirm service health"]
    Investigate --> Validate
    Validate --> Communicate["Record findings and update status"]
The diagram makes the shared validation step visible: after mitigation, confirm recovery; when no impact is found, confirm the alert source and service state. The prose can then explain what “customer impact” means in your system, who owns mitigation, and which signals count as recovery.
Add the diagram to your article
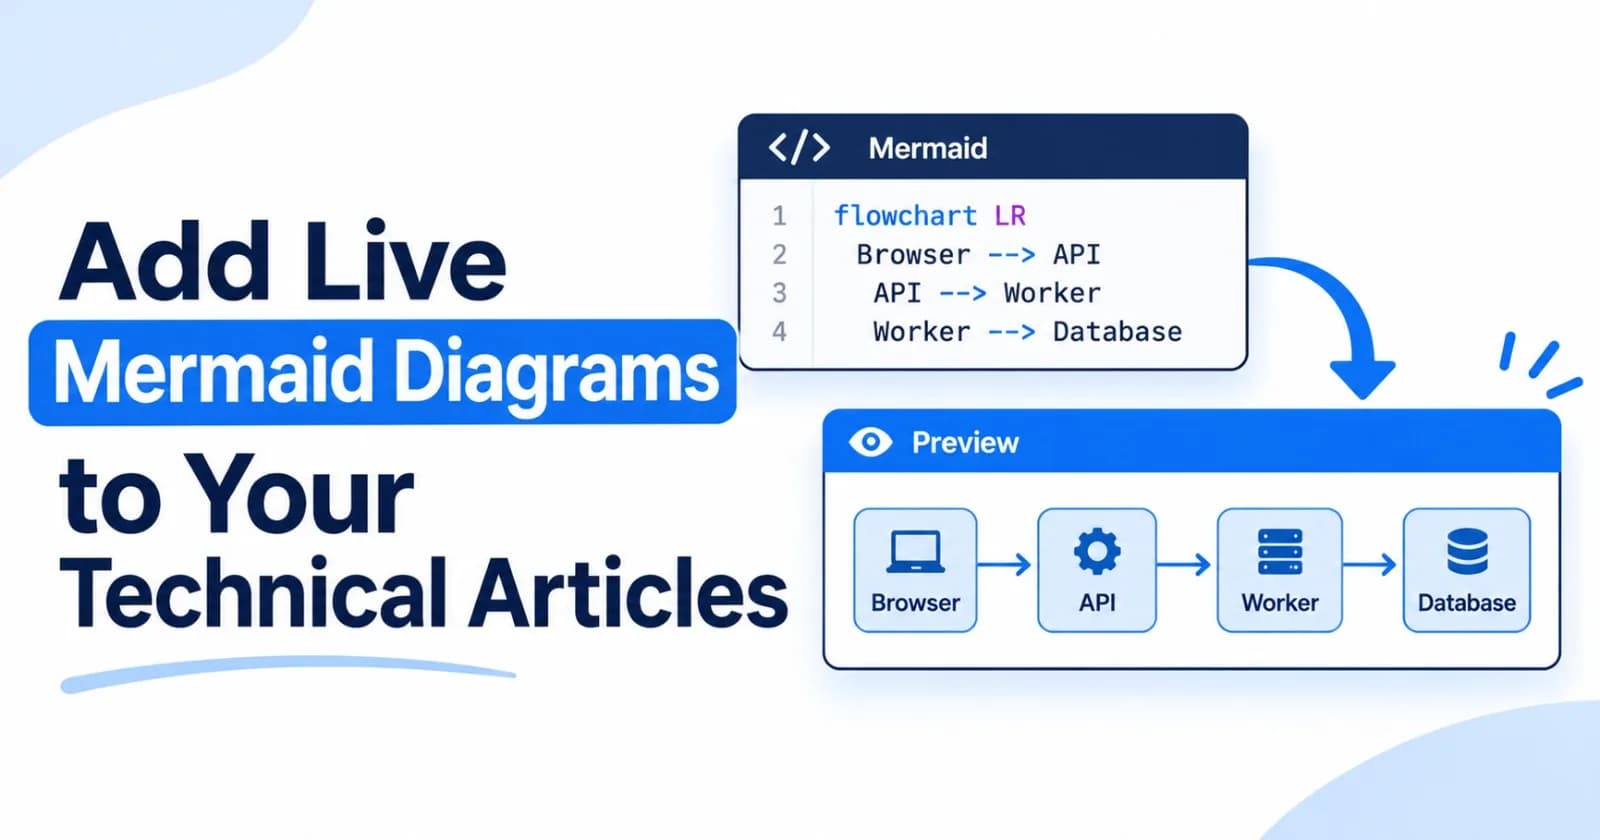
In a Markdown document, put the Mermaid definition in a fenced code block labeled mermaid:
```mermaid
flowchart LR
    Browser --> API
    API --> Worker
    Worker --> Database
```
In the ZyVOP editor, set the code block language to Mermaid. The block offers Code, Split, and Preview views, so you can edit the source and check the rendered result without leaving the article. Use the article preview too, especially when the diagram is wide or includes long labels.
The source remains ordinary text in your Markdown. That makes changes easy to review in Git, and it gives you a straightforward way to keep the diagram close to the explanation it supports.
Keep the visual easy to scan
Diagrams work best when their structure is simpler than the system they describe. A few habits help:
Use labels readers recognize. Prefer the service or action name used in the article over internal abbreviations.
Show only relevant branches. If a path is unusual, explain it in prose or give it a separate diagram.
Keep direction consistent. Use top-to-bottom for a sequence of steps and left-to-right for a pipeline or comparison.
Break up long labels. Short node text is easier to read on a phone and less likely to make the diagram too wide.
Introduce and summarize the diagram. Tell readers what to look for, then describe any implication that is not obvious from the arrows.
That last step matters for accessibility as well as clarity. A diagram should reinforce the explanation, not carry information that appears nowhere else in the article.
Check the source and the rendered result
Mermaid syntax is compact, but a missing arrow or malformed node can prevent a diagram from rendering. Preview after meaningful edits. Confirm that each branch leads somewhere sensible, labels match the surrounding text, and the result remains readable at a narrow screen width.
Also check whether the diagram reflects the current system. When an API changes or a service is removed, update the diagram in the same review as the code or documentation change. A text-based diagram is easier to maintain, but it can still become stale if nobody owns it.
Know what happens when you cross-post
ZyVOP renders Mermaid diagrams from their source in ZyVOP articles. For Dev.to, Hashnode, Medium, and WordPress cross-posts, ZyVOP replaces Mermaid blocks with PNG image references generated through mermaid.ink. Those copies show a static image rather than a live diagram and do not include the editable Mermaid source.
If a diagram is essential to a cross-post, review how it looks on that destination after delivery. Keep the explanation in the article text too, so the article still makes sense if a destination handles the image differently.
Make the diagram part of the explanation
A diagram is useful when it reduces the effort required to understand a system. Start with one reader question, draw only the path that answers it, and use the article to explain the context the picture cannot show.
With Mermaid in ZyVOP, the diagram source and the technical article can evolve together. Write the flow as text, preview the rendered visual, and keep both in step with the system you are documenting.
Comments(0)
Join the discussion by logging into your account.
No comments yet. Be the first to comment!